Content
Monitoring your subscriptions: Can’t miss this


Take another step toward becoming advanced at monitoring your subscription metrics, do you have everything under control?
You are already familiar with the benefits of subscriptions and have your subscriptions’ vitals under control, well done! 👏 Now you are wondering “ok, is it enough?” and you might have that strange feeling that you are missing something… Right?
If you want a better understanding of your subscriptions’ performance, the answer is that vitals are not enough. They give you a straightforward and essential overview, but do not provide enough depth to properly understand users’ behavior and what you should focus on.
In this article, we will take another step toward becoming advanced at subscription metrics, and will go through additional charts you should have under control, no matter if your app is iOS or Android. You don’t need to become a top expert in a few days, on the contrary, take the time to familiarize yourself with metrics, charts, and how they influence each other. Let’s start!

Before jumping on the additional metrics, let me introduce a critical concept you have to absorb by now:
No one-single metric can give you the full picture, alone.
You need to correlate different metrics to understand what’s really happening. Let me elaborate with an example:
- You see Churn Rate increasing by 10%. Excluding special situations and seasonality, this is not good news… But it’s very different if your Churn Rate is increasing in parallel to flat New Subscriptions, or if your New Subscriptions showed a significant spike, let’s say +30%. In the first case, you have to investigate asap why there is a surge of churns, and you need to fix it. In the second case, you might have been able to reach a much broader audience, and therefore it’s normal that some new users are less committed or interested in your app, they just wanted to give it a try. And they churn quickly. Overall, while you don’t want Churn Rate to increase, it can still be normal if explained by other influencing metrics. At the end of the day, if Active Subscriptions and MRR are increasing, you might be ok to have a higher Churn Rate as well, right?
Getting to know better your subscriptions
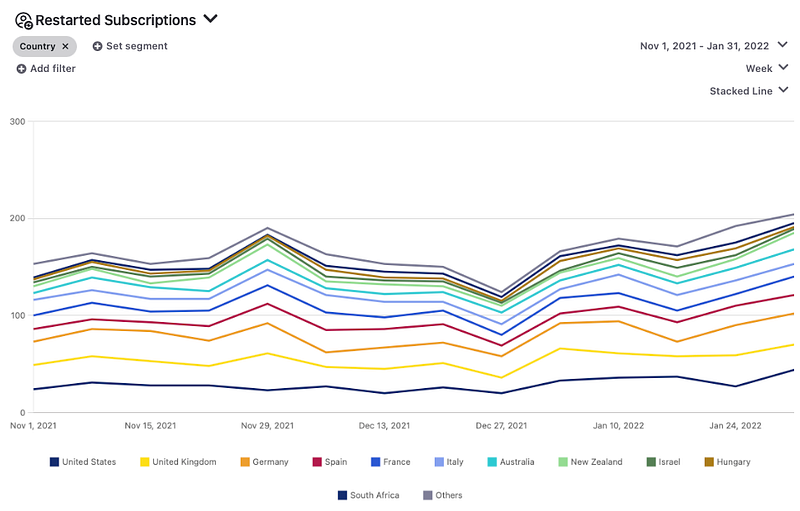
Restarted Subscriptions: Total number of subscriptions that restarted during the selected period. This includes only subscriptions that were already active in the past, but then churned at some point.
This chart is so informative to understand your users’ behavior. Do they churn and restart? Is it a similar behavior across different subscription prices/periods? Is your app associated with seasonal usage? Do users come back?
Restarted Subscriptions are one of the most underrated metrics in the app industry because usually Restarted Subscriptions are much less than the New Subscriptions… But in the long term, they not only are some of the highest value users but also provide precious insights into users’ behavior.
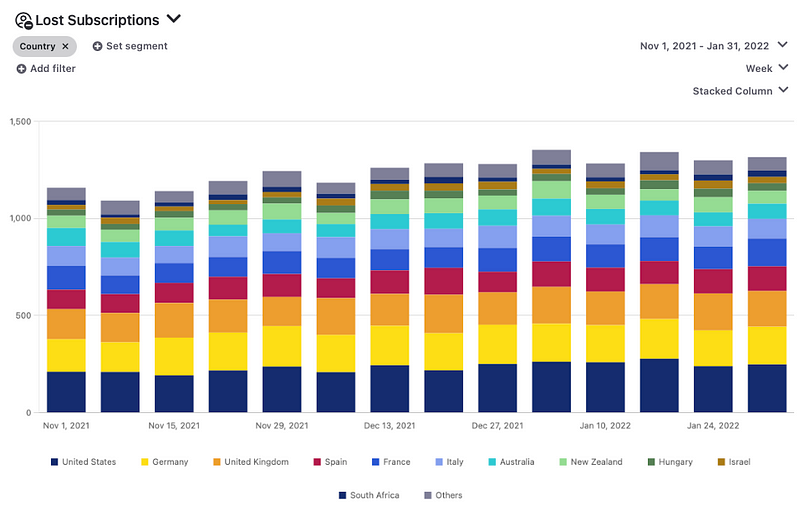
Lost Subscriptions: Total number of subscriptions that churned during the selected period.
This is definitely a number you want to keep low… But “0 churn” is just unrealistic and you should make sure you understand why Lost Subscriptions spike/drop, more than wondering why it is not zero. Lost Subscriptions can give great insights on issues with the app, and are strongly affected by the quality of users you bring in with marketing activities.
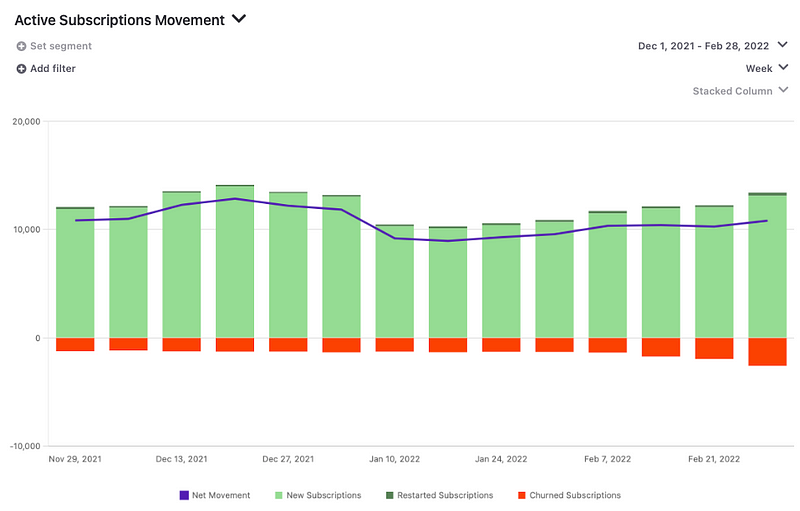
Active Subscriptions Movements: Number of New Subscriptions plus Restarted Subscriptions minus Lost Subscriptions, and the “Net Movement” for the selected period.
In a single chart, you get the full picture of your subscriptions trend: Are they increasing, flat, or decreasing? When you just need an overall snapshot of your subscriptions trajectory, this is the single chart for you.
A better picture of your financials
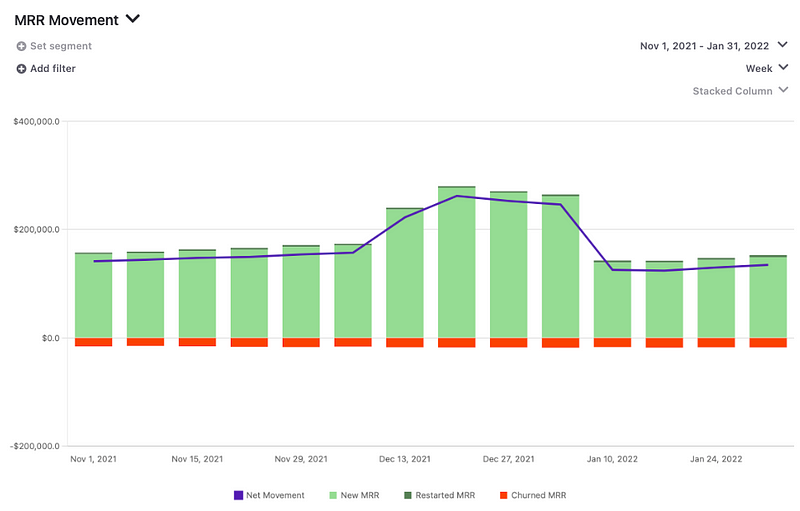
MRR (Monthly Recurring Revenue) Movements: Total of New MRR plus Restarted MRR minus Lost MRR, and the “Net Movement” for the selected period.
Similarly as for Active Subscriptions, MRR trends can be monitored with a single chart. If you just need a high-level picture of how your MRR is evolving, make sure you have this chart in your reports.
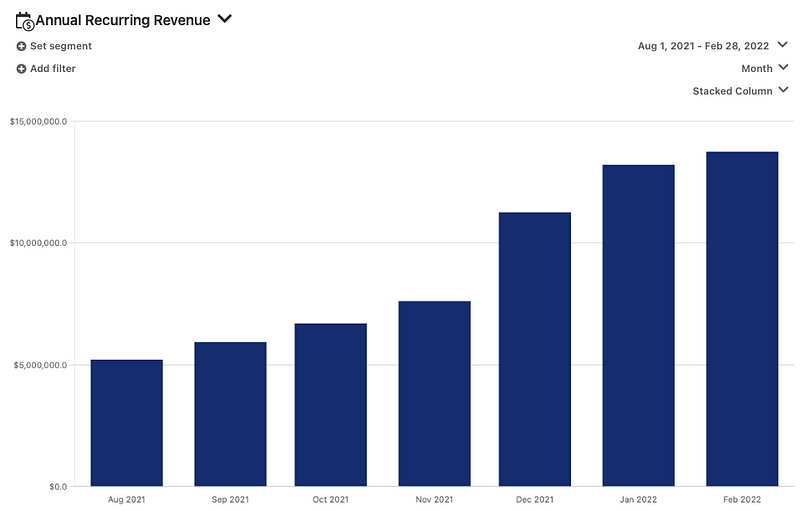
ARR (Annual Recurring Revenue): While MRR measures the recurring revenue generated each month, ARR measures the recurring revenue generated for a year. For forecasting purposes, the MRR is used to forecast Annual Recurring Revenue for the next 12 months, assuming no change in the customer base.
After having a clear understanding of your MRR, which is widely used to analyze SaaS and app financials, monitoring your ARR will give you a better understanding of other types of economics, including your annual P&L. Quite useful for planning!
Predicting the future better
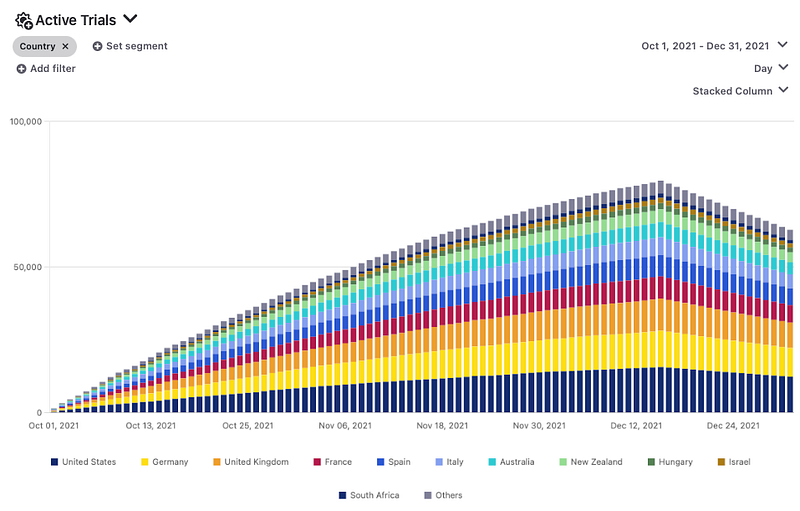
Active Trials: Total number of trials that started and didn’t convert or churned yet, and that are therefore currently active. This is a very special portion of your users that might become new subscribers, so you must have a sense of how many new subscriptions might convert in the coming days.
Compared to New Trials, Active Trials are less exposed to spikes and drops, including Active Trials starting from DayMinusN to Day0, being N the number of days offered with the free trial. The longer is the free trial period, the less exposed to spikes and drops your Active Trials trend will be.
Never-ending process
After gaining a clear understanding of the benefits of subscriptions and which basic subscriptions metrics to monitor, you need additional metrics and charts to better understand your user base and app performances. The metrics discussed in this article offer great insights–or shortcuts in the case of the “movements”–you need when you want to take a step forward in mastering your app performances.
Both AppStore and GooglePlay don’t provide all of these charts–and forget real-time!–and it’s often unproductive to build internal infrastructure to handle such complexity in-house: App stores’ events are not easy to handle and understand.
If you want to focus on your core business and leverage a top-notch infrastructure, have a look at how Glassfy can provide you with the analytics you need on top of the complete infrastructure you need to build, manage, and grow in-app subscriptions.
If you liked the article, don’t forget to follow Glassfy to stay updated with new articles on how to build, manage, and grow in-app subscriptions.
By Francesco Zucchetta on April 20, 2022.
Exported from Medium on November 23, 2022.
Read More